2025 Year in Review: Non-Agency CRE Securitization Reaches $157 Billion
 Steve Baumgartner, Sep 2025 - 10 min read
Image source: Unsplash
2025 Achievement
Our 2025 CRE securitization report reveals that combined non-agency CMBS and CRE CLO markets reached $157.3 billion. This marks the strongest annual performance since the pre-financial crisis peak of 2007. This 2025 CRE securitization report shows non-agency CMBS contributed $126.8 billion, while CRE CLOs added $30.5 billion. These results demonstrate the breadth and resilience of capital markets channels supporting commercial real estate.
Non-Agency CMBS Market Overview
December closed the year with $10.6 billion in non-Agency CMBS issuance across 14 deals, bringing 2025 to an 18.7% increase over 2024’s $106.8 billion. The year’s trajectory, from April’s $3.3 billion trade policy-induced low point through a sustained second-half surge averaging $11.0 billion per month, validates the market’s ability to absorb disruption and maintain momentum.
Source: Commercial Mortgage Alert, Morningstar Credit
Deal Composition Analysis
Single Asset Single Borrower (SASB)
December’s eight SASB deals totaled $5.7 billion. Hospitality properties dominated, accounting for $5.0 billion or 88% of monthly SASB volume.
The headline transaction was Blackstone’s $2.85 billion refinancing of the Aria Resort & Casino and Vdara Hotel & Spa in Las Vegas. This represented the largest single SASB deal of the entire year.
The December SASB property mix was:
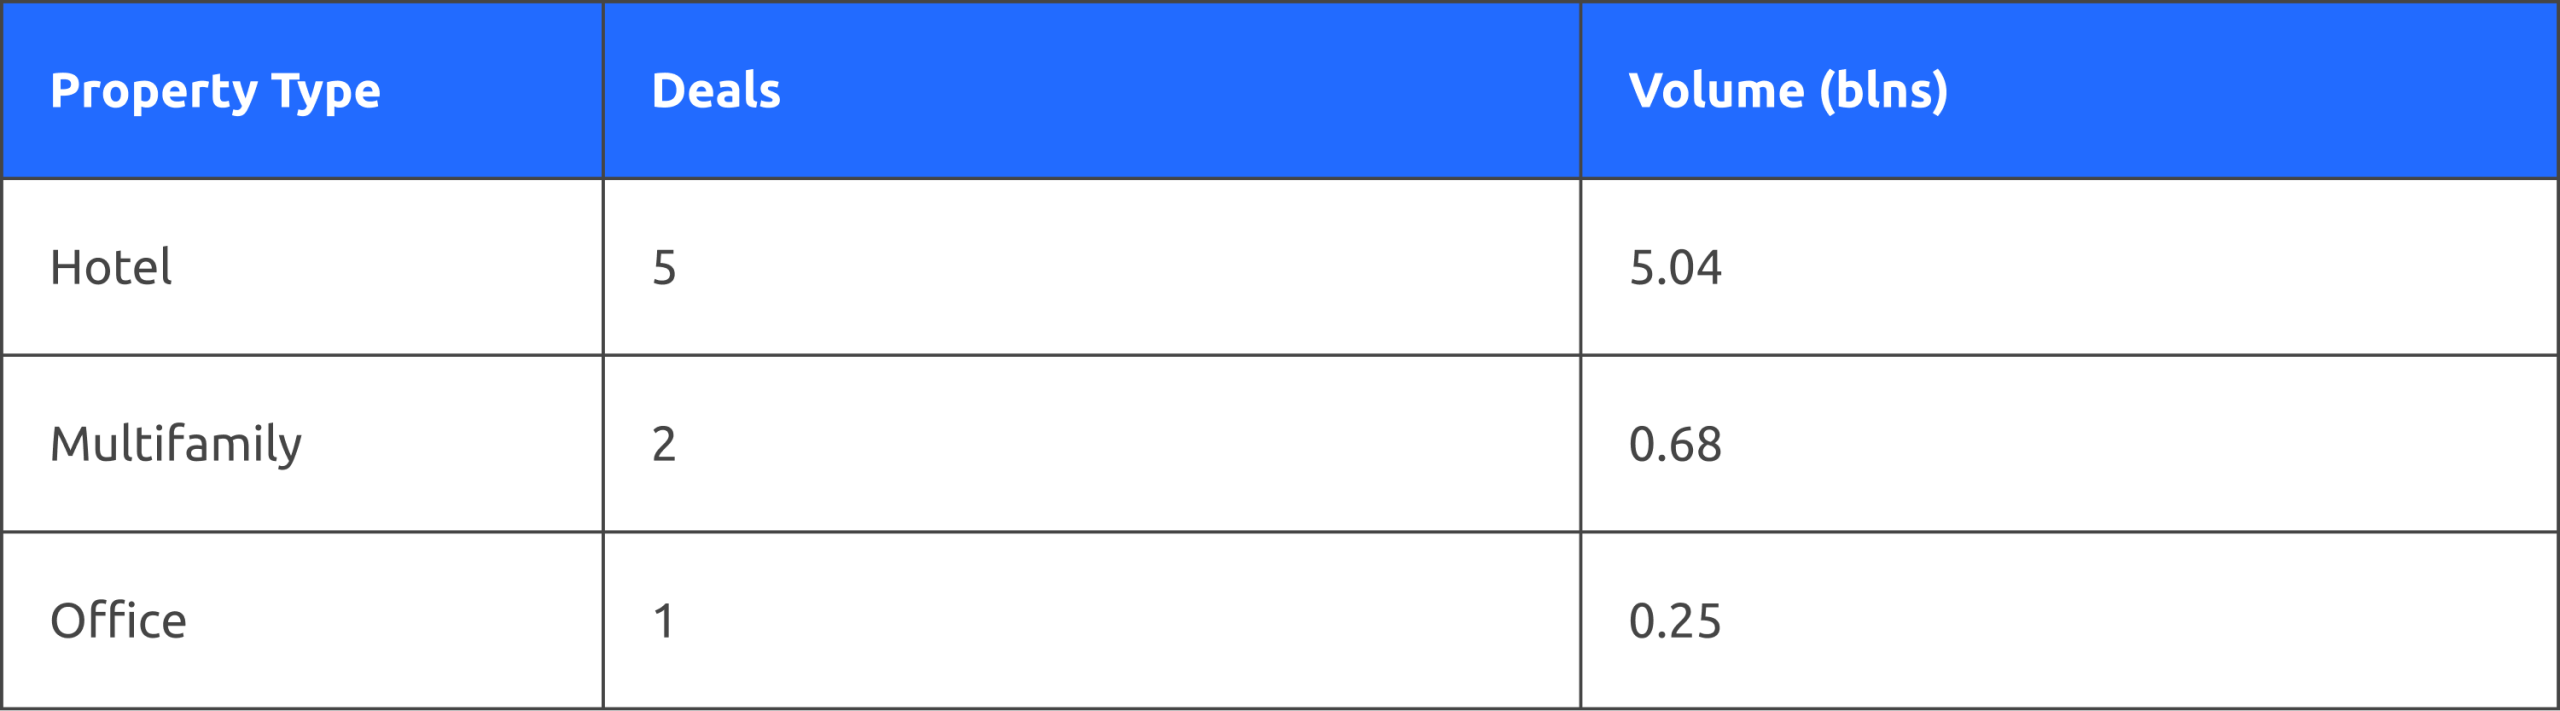
The hotel concentration featured several marquee resort financings. These included the $1.15 billion refinancing of the Boca Raton Resort. Other properties included assets in Salt Lake City, Manhattan, and California.
The quality and scale of these transactions show continued [investor appetite for commercial real estate debt]. These deals featured premier hospitality assets with institutional sponsorship. Multifamily contributed two student housing and urban residential deals. The office was represented by a single Atlanta CBD property. Google leases this property primarily.
Full-Year SASB Performance
For the full year, 126 SASB deals accounted for $91.1 billion, representing 71.8% of non-Agency CMBS issuance. Office properties led annual SASB volume at $25.7 billion across 36 transactions, demonstrating that institutional-grade office assets continued to find strong demand despite broader sector headwinds. Industrial properties followed closely with $15.8 billion across 23 deals, while hotels contributed $16.2 billion across 23 transactions.
The 2025 SASB property breakdown:
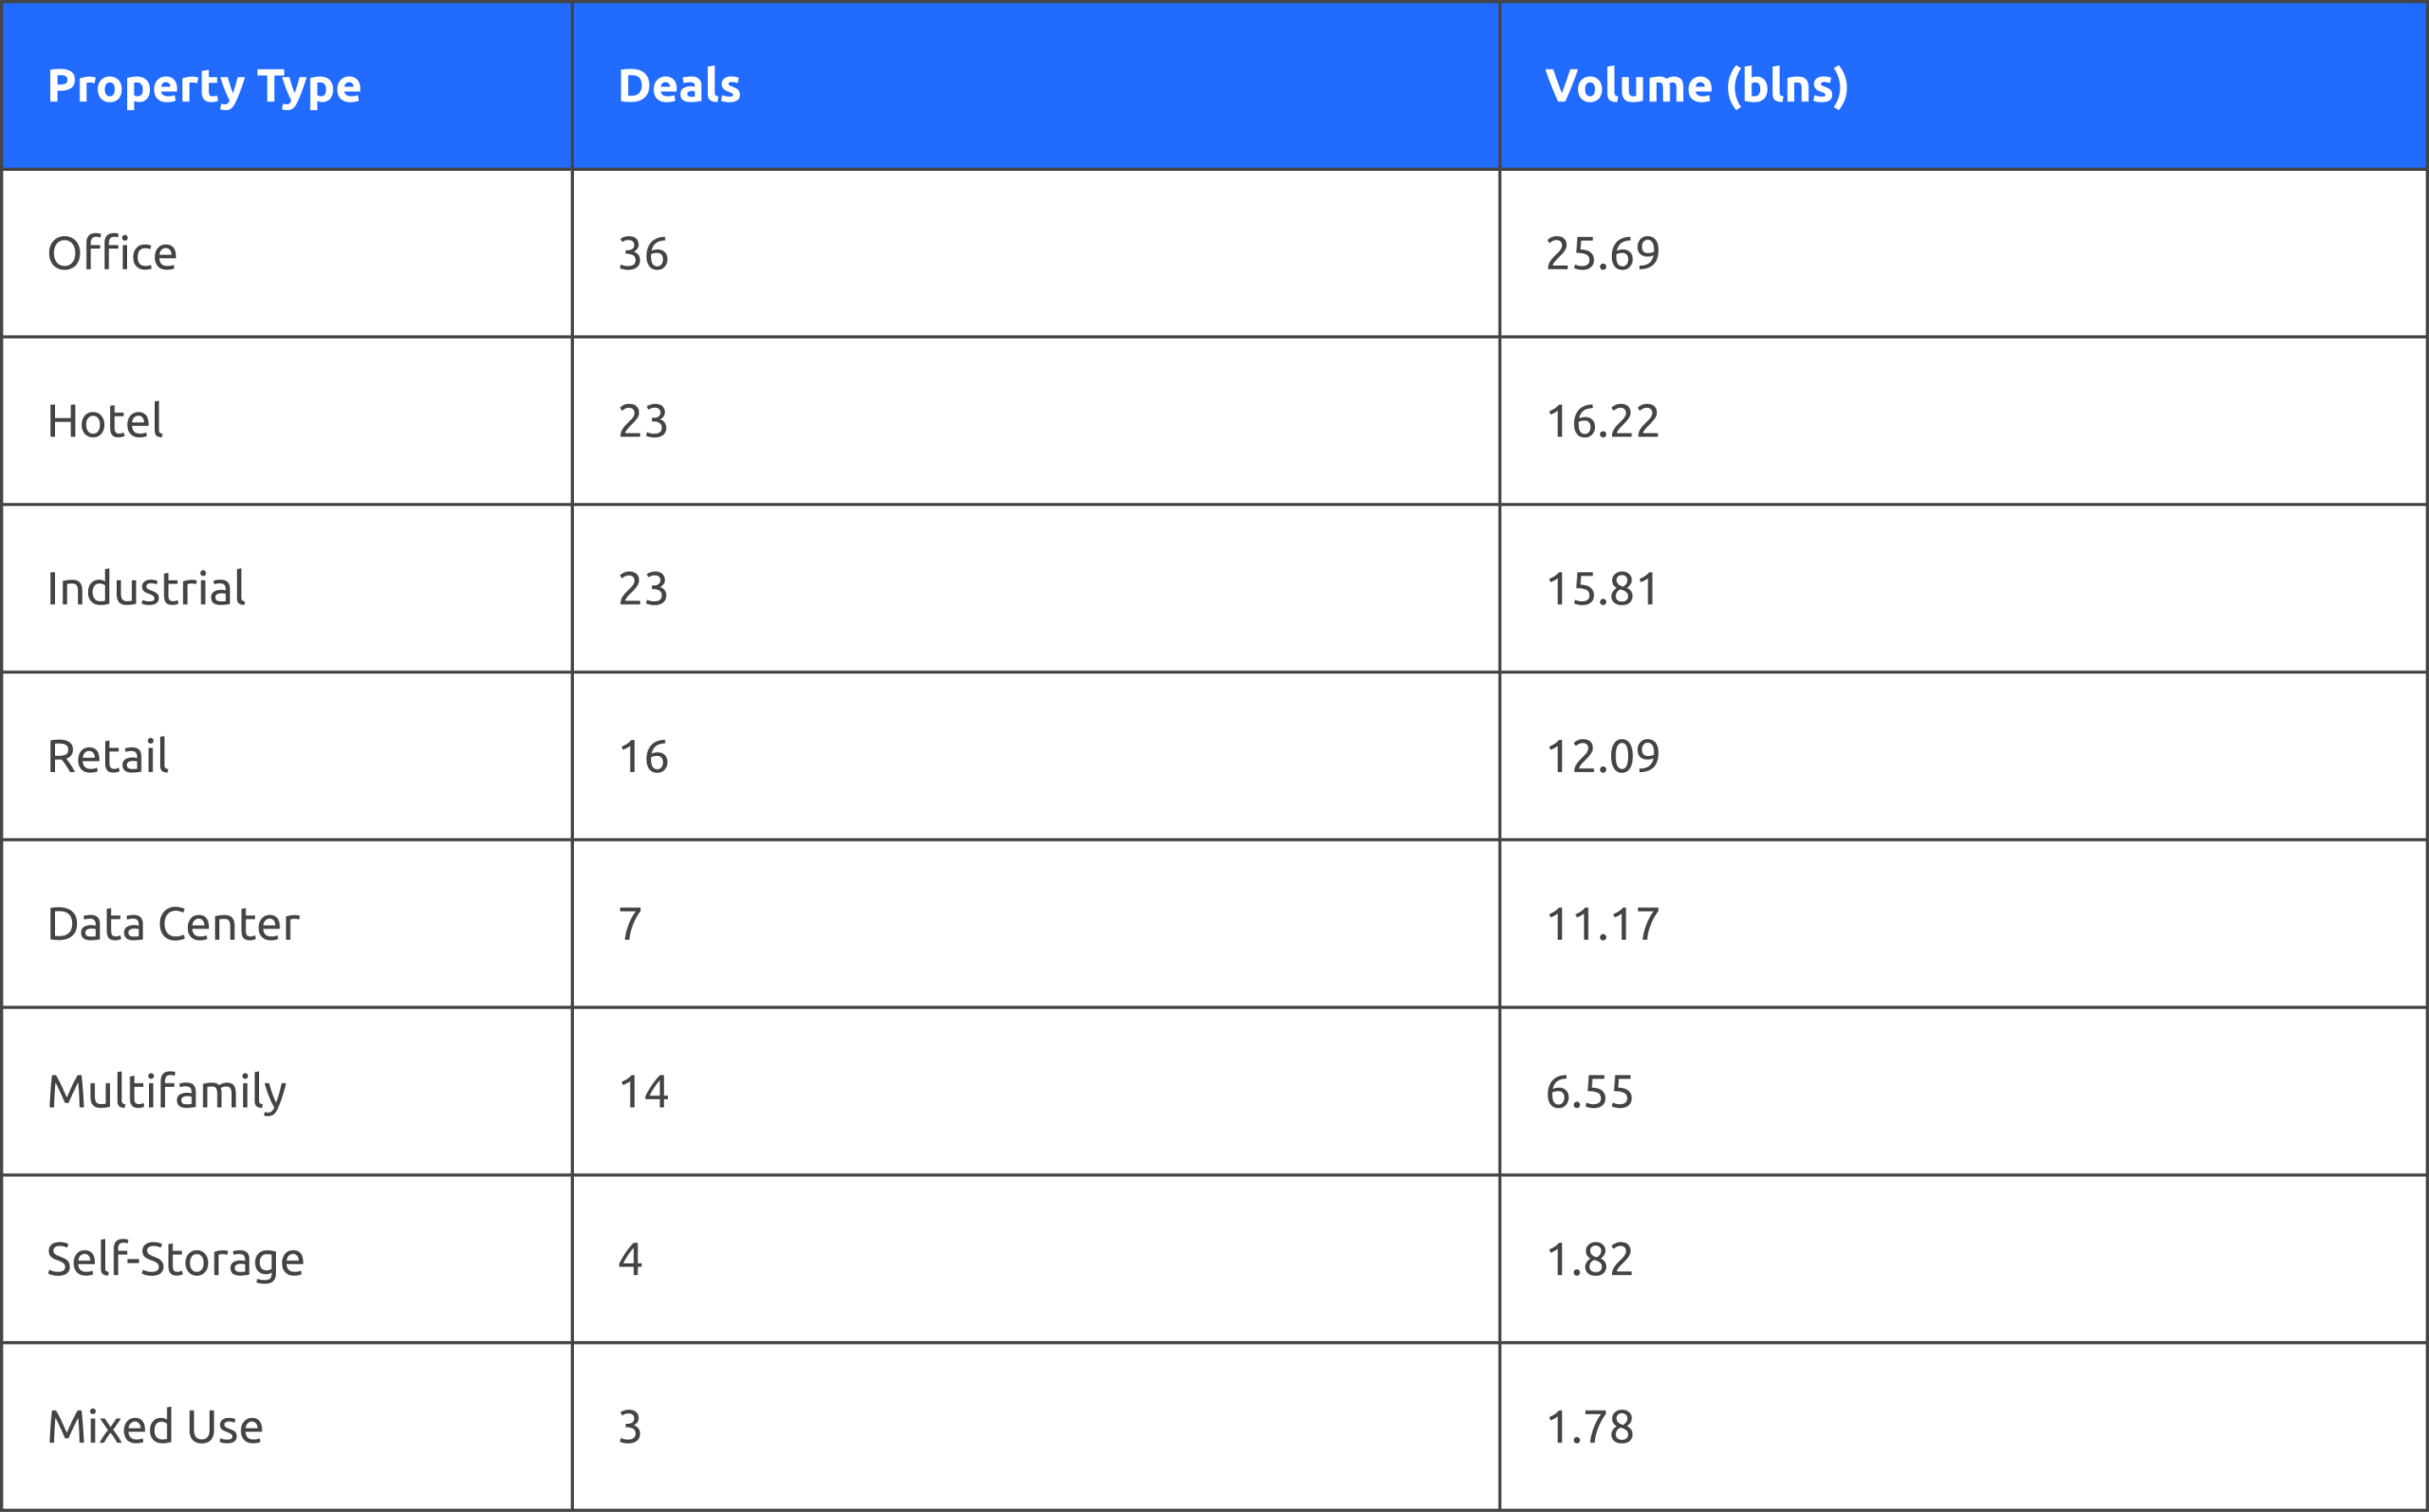
The diversity across property types reinforces that quality and sponsorship trump sector concerns in today’s market. Notably, data center deals commanded the highest average deal size at $1.6 billion, reflecting the scale of institutional capital flowing into AI and tech infrastructure.
Conduit Deals
December’s conduit market delivered its strongest month since September with six deals totaling $4.9 billion. This represented a significant rebound from November’s two-deal showing and provided an encouraging close to a year marked by conduit volatility. The improved December execution suggests that when lenders successfully aggregate collateral heading into periods of strong market demand, robust investor reception follows.
Full-Year Conduit Performance
Across 2025, 44 conduit deals totaled $33.7 billion, representing 26.6% of non-Agency CMBS volume. While monthly activity varied, ranging from $1.4 billion in April to $4.9 billion in December, the market demonstrated its ability to execute when conditions aligned. Average conduit deal size reached $765 million, with September and December each producing billion-dollar transactions that marked a return to a more meaningful scale.
The key takeaway from 2025’s conduit performance is that investor demand remains strong when deals come to market. Execution quality and pricing were consistently solid throughout the year, indicating the variability in volumes stems from the aggregation process rather than market receptivity. The 44 transactions brought diverse collateral pools to market and achieved good execution, validating the conduit channel’s ongoing relevance in the CMBS ecosystem.
Source: Commercial Mortgage Alert, Morningstar Credit
CRE CLO Market
The CRE CLO market closed 2025 with one deal for $951 million in December, bringing full-year issuance to $30.5 billion, just above 2022’s $30.3 billion and firmly establishing the asset class’s recovery. While still below 2021’s $45 billion peak, the 2025 performance represents a remarkable turnaround from 2023-2024’s combined $15.4 billion, validating the CRE CLO market’s evolution into a sustainable financing channel for transitional commercial real estate.
Source: Commercial Mortgage Alert, Morningstar Credit
2025 Annual Retrospective
Monthly Performance and Key Turning Points
2025’s monthly issuance told a story of resilience and recovery. February’s $19.3 billion peak established early momentum before April’s $3.3 billion low point, driven by trade policy uncertainty, which tested the market’s fortitude and had some fearing dark days to come. Fortunately, those fears proved unfounded as the recovery was swift and sustained: May through December averaged $11.0 billion per month, with three months exceeding $12 billion.
Full-Year Product Mix
Non-Agency CMBS breakdown by product type:
- SASB: $91.1 billion (71.9% of total) – Dominated by office, industrial, and hotel properties
- Conduit: $33.7 billion (26.6% of total) – Marked by inconsistent monthly volumes but strong execution when deals came to market
- Specialty: $2.0 billion (1.5% of total) – Lease-backed and seasoned collateral transactions
The SASB dominance reflects both investor preference for single-asset transactions backed by quality real estate and institutional sponsors, as well as issuers’ ability to execute more efficiently without the aggregation challenges that characterize conduit deals. This dynamic remained consistent throughout the year despite varying property type concentrations month to month.
2026 Outlook: Building on a Strong Foundation
Market Positioning and Growth Potential
The foundation established in 2025 positions the commercial real estate securitization market for continued growth in 2026, with potential to reach $170-185 billion in combined CMBS and CRE CLO issuance. This optimistic outlook is supported by several favorable tailwinds: rate stability following the Fed’s easing cycle, potential for additional rate cuts if economic conditions warrant, and stabilizing property fundamentals across key sectors.
The path to $170-185 billion represents 8-18% growth over 2025’s $157.3 billion, a reasonable trajectory given the market’s demonstrated ability to sustain $10+ billion monthly averages and the likelihood of continued investor appetite for quality commercial real estate debt.
Property Market Dynamics
2026’s growth will be supported by strong performance across multiple property sectors. Class A assets in gateway markets will continue to lead execution, but improving fundamentals and rate stability should broaden investor appetite to well-positioned properties in strong secondary markets as well. The bifurcation evident in 2025, where quality and sponsorship commanded premium pricing, is likely to persist, but the overall market expansion suggests capital will flow to a wider range of transactions.
Office properties are expected to show continued differentiation, with trophy CBD towers attracting premium capital while well-located, suburban assets with top amenities gain traction as hybrid work models stabilize. Multifamily and industrial properties remain positioned for strong performance given favorable supply-demand dynamics and established investor comfort. Hospitality assets, having demonstrated resilience in 2025 with $16.2 billion in SASB volume, should continue finding receptive markets for quality properties with proven operating track records.
The key for 2026 will be the market’s ability to extend beyond the core institutional assets that dominated 2025, bringing well-sponsored transactions across a broader spectrum of property types and locations to market. Early indications suggest investor appetite exists for this expansion, particularly if rate stability and economic growth continue.
Conclusion
The commercial real estate securitization market’s 2025 performance with $157.3 billion across CMBS and CRE CLO channels represents a definitive statement about the market’s resilience and continued relevance. From April’s trade policy disruption through December’s strong finish, the year demonstrated both the market’s capacity to absorb volatility and its ability to sustain momentum through diverse product channels and consistent investor demand.
The foundation is firmly established. With 126 SASB deals, 44 conduit transactions, and robust CRE CLO activity, the market proved its depth across property types and capital structures. The emergence of specialty products like seasoned collateral deals and the return of billion-dollar conduit transactions signal a maturing, diversifying market with multiple execution paths.
As we enter 2026, the trajectory points toward continued growth, with potential to reach $170-185 billion driven by rate stability, improving property fundamentals, and the institutional knowledge gained through 2025’s exceptional performance. While macroeconomic uncertainty and sector-specific challenges remain, the market has answered definitively: commercial real estate securitization has reclaimed its essential role in capital markets and is positioned to build meaningfully on this success.
The question for 2026 is not whether the recovery can be sustained, but rather how far the expansion can extend. The market has the momentum, the capital, and the confidence earned through a year that exceeded expectations and validated the strength of commercial real estate as an asset class.


